Envision
Real-Time Progress Analytics
Actionable design & verification progress analytics at scale
IC Manage Envision real-time progress analytics platform uses big data technology to report on design & verification progress, interpreting & providing visual reporting on millions of data points across billions of records in near real time.
Because Envision is 10-100X faster than traditional methods, engineers and engineering management can get data-driven insights routinely. They can customize their dashboard and progress thresholds, view visual summaries at the global level and drill down to local levels.

Verification progress analytics
Envision delivers near real-time customized visual analytics across the verification tool spectrum, for any mix of EDA vendors. Engineers and engineering management can instantly understand their verification progress at IP, subsystem or full SoC levels, including viewing relevant design activity.
Design progress analytics
Design leads can use Envision’s customizable design & IP progress analytics to view detailed progress reports for each IP across all specified tools.
The tool enables teams to better focus resources to meet delivery deadlines.
10 to 100x faster access to data — across mixed vendor environments
Fast data access. 100x faster than file analysis and at least 10x faster than traditional database backends. The access speed is extremely critical with verification data growing exponentially.
Spans verification tools. Collect data from all verification tools, such as simulation, formal verification, and emulation — across mixed vendor environments. Supports relevant log data from multiple EDA vendor verification tools, without the need to maintain custom interfaces.
Real-time verification progress — Visual analytics
Envision uses big data techniques to structure the data and enable real time analytics, reporting, and queries across massive peak data volumes. It covers the verification tool spectrum, such as formal, simulation, and emulation tools — and supports mixed vendor & multi-cloud environments.
Regression analytics. Teams can set regression pass/fail milestones and track progress over time.
Bug tracking analytics. An engineer can automatically create a ticket for further debugging when a test fails, or update the bug status to pass, fail, or needs investigation.
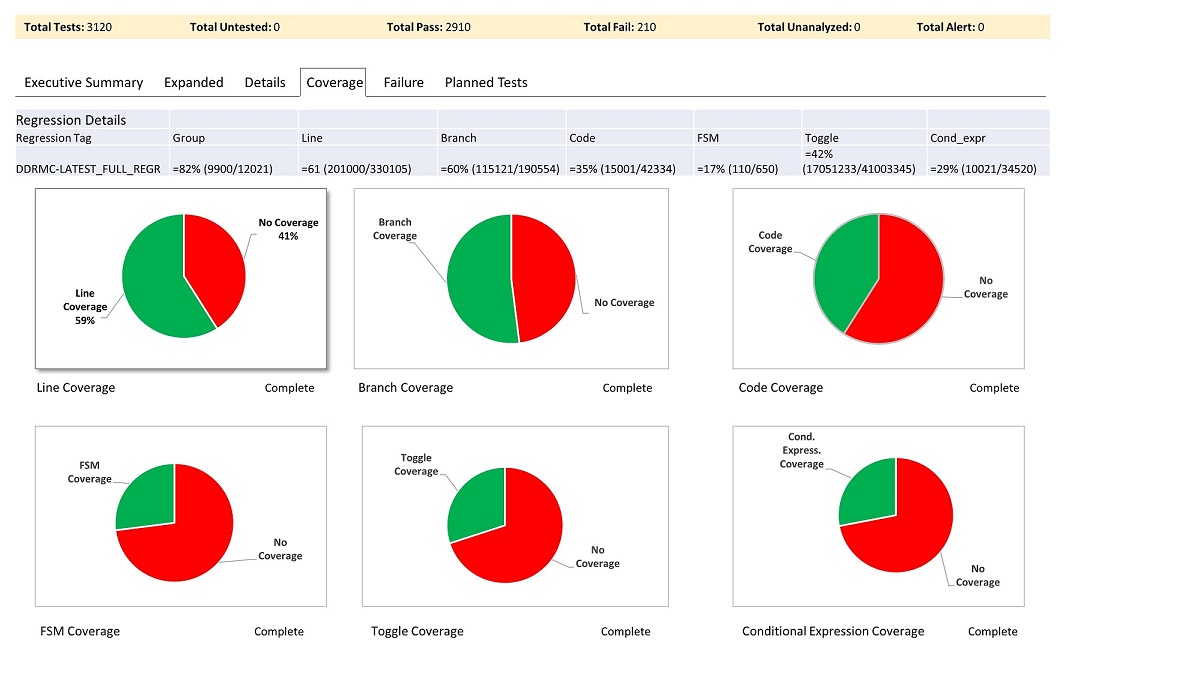
Coverage Progress analytics. Design & verification engineers can identify coverage results against pre-set targets and plans. They can set targets across any number of domains, such as line, branch, FSM, code, and functional. By analyzing data across the spectrum of results, they can more accurately predict milestone dates.
Verification bottlenecks linked to design changes
RTL designers can resolve verification bottlenecks even faster with direct links from the Envision verification analytics to their design and IP changes and activity. For example, a regression set that changes from pass to fail can be linked to source file or test bench changes, for root cause analysis. Engineers can see:
- who made a recent change
- when they made the change
- what the change was
This functionality is enabled by IC Manage’s unique underlying technology, which interconnects unstructured verification results data and structured design data into a hybrid database. Additionally, Envision analyzes test failure signatures so that repetitive failures and corresponding fixes can be tracked as a group — leading to faster identification and resolution of common issues.
Real-time design progress & resource optimization
SoC/Chip real-time design progress
Assembly leads can view real-time detailed progress reports for each IP across any number of specified tools. Engineers can define automatic threshold levels for each tool to quantify progress, then easily modify the threshold levels at any point in time. For example, they might specify error counts for DRC and LVS.
Teams can view snapshots of the evolving design progress in real-time, while minimizing the burden of asking team members and management to spend scarce project and design time compiling status reports that are frequently out of date.
The more frequent access to reports and deeper insights enables uncovering and addressing delays as early as possible.
Tool drilldown for resource optimization
Envision effectively utilizes the design tool log files that are typically discarded today. For example, the number of bugs found during a project will vary over time. As the RTL stabilizes, teams will see a downward trend in the bug count indicating that the project is on track for completion.
By filtering and tracking the bug count across relevant IPs and projects, Envision can automatically flag and identify delays in the downward trajectory, and extrapolate to determine the expected completion of all project phases.
This tool drilldown can then be tied back to a particular IP team or user group, for improved decision making on where to focus additional engineering, compute, or license resources to advance the project.
“Infinitely” user-customizable, interactive reporting
Envision real-time analytics can be completely customized via RESTful API to provide specific dashboards to track goals, add new tool data and track convergence to project targets.
Engineers can targets set across any number of domains, e.g., line, branch, FSM, code, functional…
Visual analytics provide summary rollup reports of verification progress versus plans, teams, and sub-systems — along with detailed reporting at more granular levels — enabling management to focus on project progress and optimize resource allocation.


