Functional Verification Big Data Analytics — Real-Time Global & Local Insights
White Paper by Shiv Sikand, Executive Vice President, IC Manage
1. Overview: Accelerating Verification Schedules using Big Data Analytics
Using big data technology for verification analytics helps accelerate functional verification schedules. It offers key advantages to production verification environments, including those with a mix of tools from multiple EDA vendors.
Companies can run hundreds of thousands of regressions a day and up to 10 billion events or more a year. Existing analysis methodologies are not scaling with these increasing data rates. As a result, access to verification reports based on log data can be very slow.
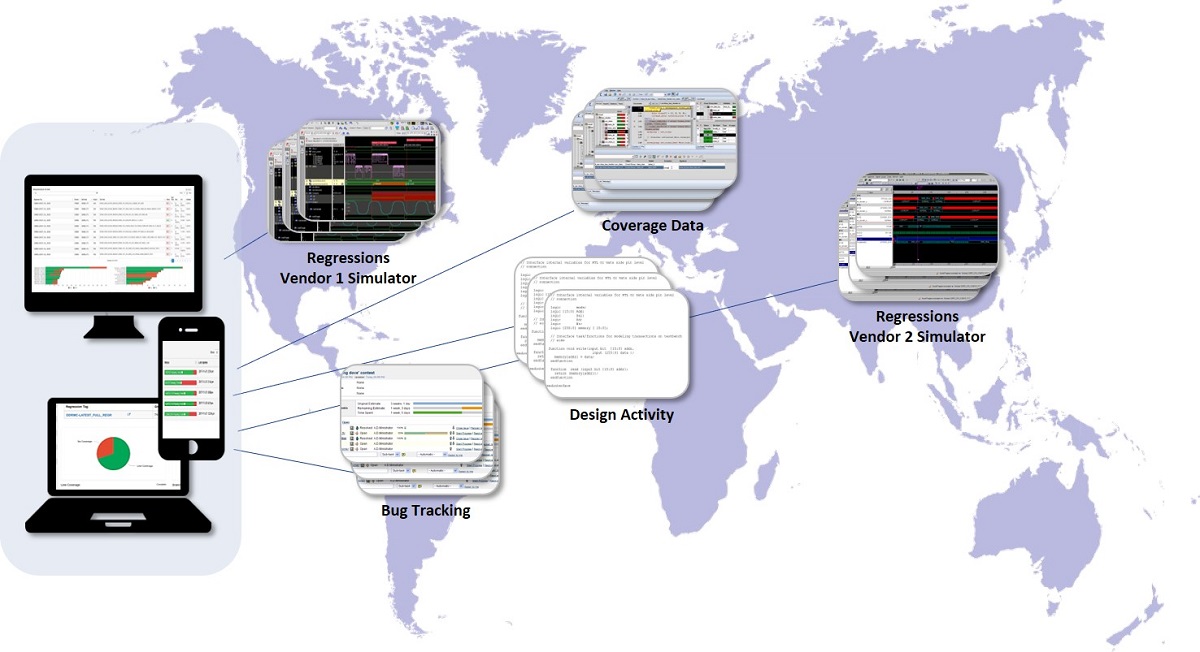
With IC Manage Envision Verification Analytics, authorized engineers can immediately view key metrics against customized targets for regression runs, debug convergence, and coverage progress.
This allows verification teams and management to identify verification bottlenecks and understand their root causes to best apply resources to meet tight schedules.
Business Challenge
• Reduce time to verification closure
Verification Challenges
• Timely identification & resolution of verification bottlenecks
• Analytics slowdown & inability to scale to simulation & data expansion
• Verification tools from multiple vendors on demand
• High system maintenance overhead
IC Manage Solution
• IC Manage Envision Verification Analytics
Results
• Near-instant verification progress visual analytics and interactive reports
• Global & local understanding of regressions, bug tracking and coverage against customized metrics
• Faster root cause resolution cause due to links to design activity
• Verification progress milestone predictions over time
• Easy setup, minimal maintenance for multi-verification vendor environment
2. Challenge: Existing verification progress metrics analytics not scaling with data explosion
Existing methods for tracking, summarizing, and analyzing verification simulations has several limitations.
2.1 Current Analytics do not scale with increasing simulations
Verification team can run hundreds of thousands of simulations per week. Trying to recognize sub-events can mean managing as many as 10 billion events in a year. This number can be expected to double over the next couple of years for some companies.
Some companies have developed in-house systems, with the goal to derive verification progress metrics for tools from multiple vendors. However, the traditional relational database structures are not scaling with their increasing simulations.
2.2 Slow analytics query speed, Limited analysis
Poor overall system performance results in a low query speed. When companies experience substantial system degradation due continuous queried for each user request and for each data record insert, the system may not even be able to render the data to the user for more than a few thousand simulations.
Companies can often only execute basic analysis of regressions, debug and coverage. Key additional analytics insights can be missing, for example recognizing sub events within a single simulation, or identifying simulation runs grouped in a variety of user and organizationally defined containers.
2.3 High overhead, Multi-vendor support
For companies trying to support two or more different vendor simulators, verification environments and tests, the ongoing effort and debug required for scripts and updates is high. Traditional architectures can also create duplication and not allow record updates. Reducing the overall data footprint and improving performance can require scheduled data deletions.
3. IC Manage Envision VA – Real-Time, Functional Verification Big Data Analytics
IC Manage Envision Verification Analytics uses big data techniques to give you near instant verification progress metrics, visual analytics, and interactive reporting even during peak regression times. it can be for any verification initiative, such as simulation, formal and emulation. It can also link to design activity and changes.
IC Manage Envision Verification Analytics enables verification engineers and management to:
- Obtain customized verification progress analytics against targets
- Gain progress insights to identify bottlenecks early
- Uncover the root cause of bottlenecks to resolve them quickly.
It delivers these results with a low query speed, plus as a low overhead for multi-vendor environments.
4. Global & Local Verification Insights — Anytime, Anywhere
 4.1 Regression analytics – scalable global & local views
Envision-VA has a regression dashboard for all team members. Each verification engineer can run a regression and Envision will access their regression log data to show which regressions passed and failed. The results can be grouped based on signatures. Authorized team members can also look at another engineer’s regressions for the same IP block.
Managers can use Envision to understand both individual and group progress with regression activity, such as viewing how many tests are coded, and looking at pass rates versus expected. They can also look at the regressions over a specific time period and perform additional analytics – for example, to see whether there is any degradation in progress with new regressions.
4.2 Bug management progress with automatic updates
Envision-VA has integrated bug tracking. If a test fails when a regression is run, a verification team member can look at the signature to see whether a bug had been assigned. If there is no bug assigned yet, the engineer can use Envision to automatically create a signature and assign a category for the bug. If there is a bug assigned, they can ignore it, or update the bug status to: pass, fail, or needs investigation.
If there are multiple fails from the same signature, the results can be correlated to design activity — as discussed in section 4 below — and then assign a ticket for further investigation by a specific design group.
4.3 Coverage analytics & Milestone estimations
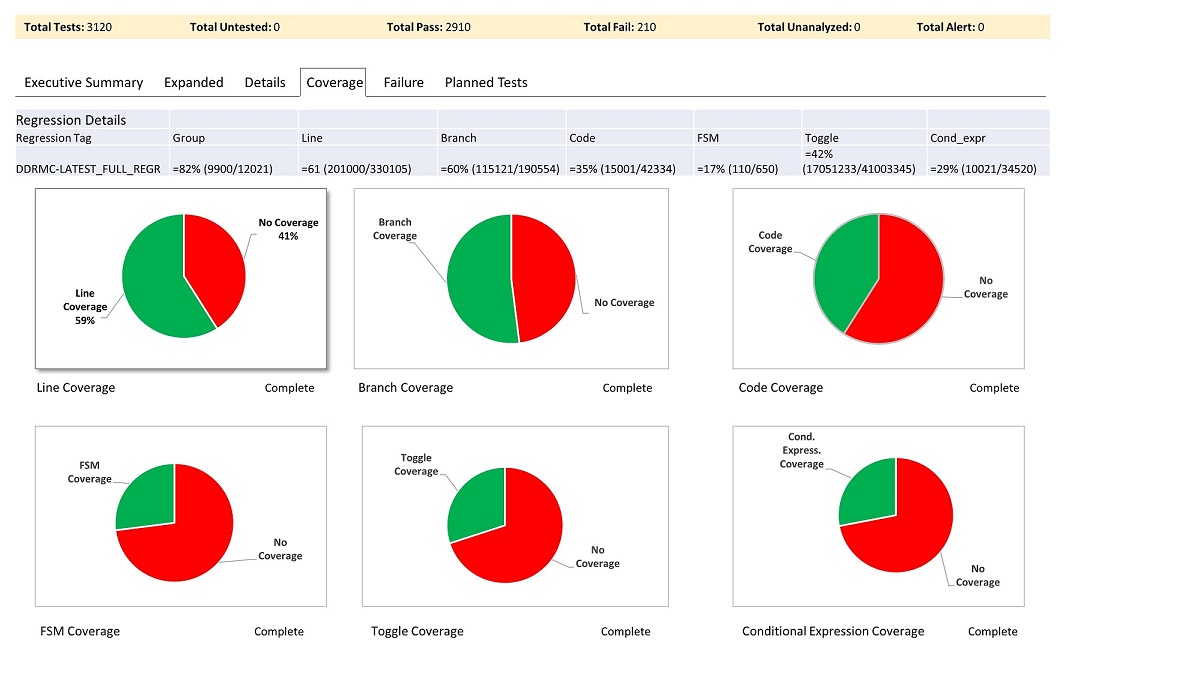
Individuals and managers can pre-set metrics and targets for verification coverage. Envision can use an infinite number of code data points, so the coverage analysis can be fine grained for any situation. Companies can set targets across any number of factors, such as line, branch, functional, finite state machine, code, etc. Envision can even recognize subevents within a single simulation.
Engineers push the coverage log data into Envision, and the tool will analyze the regressions to create visual analytics of the coverage, such as measuring the regression pass rate against planned coverage, and much more. Envision will also allow you to analyze the data trends over time, and estimate coverage milestone dates.
In addition to tracking overall progress, managers can also group the regressions by specific users to check individual coverage progress over a time period. The design activity links discussed below, will help to quickly identify the root cause and apply resources accordingly.
Managers can monitor to see if the total bug count is going down over time or not, or if there are an unusual number of bugs from same area.
5. Root cause analysis: Verification bottlenecks linked to design changes
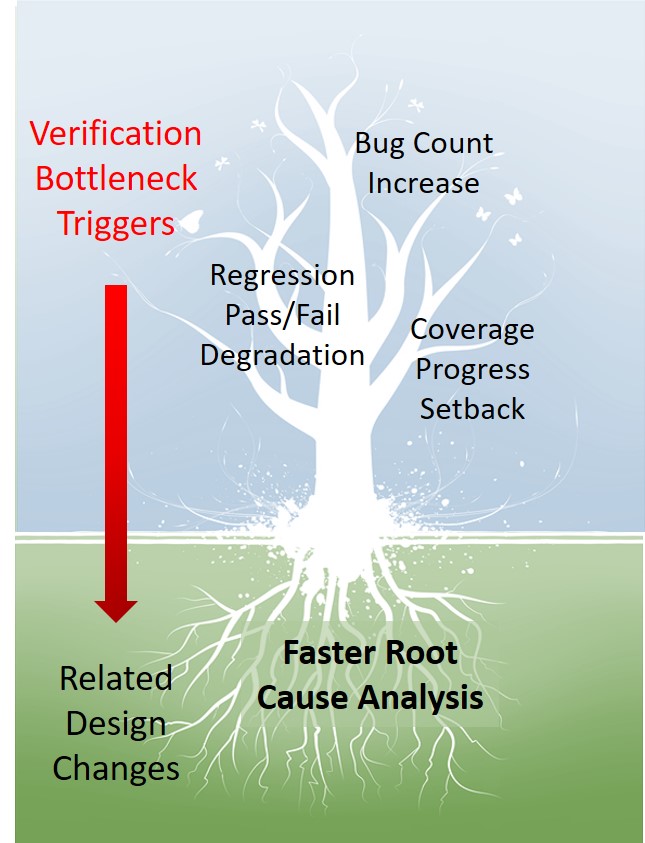
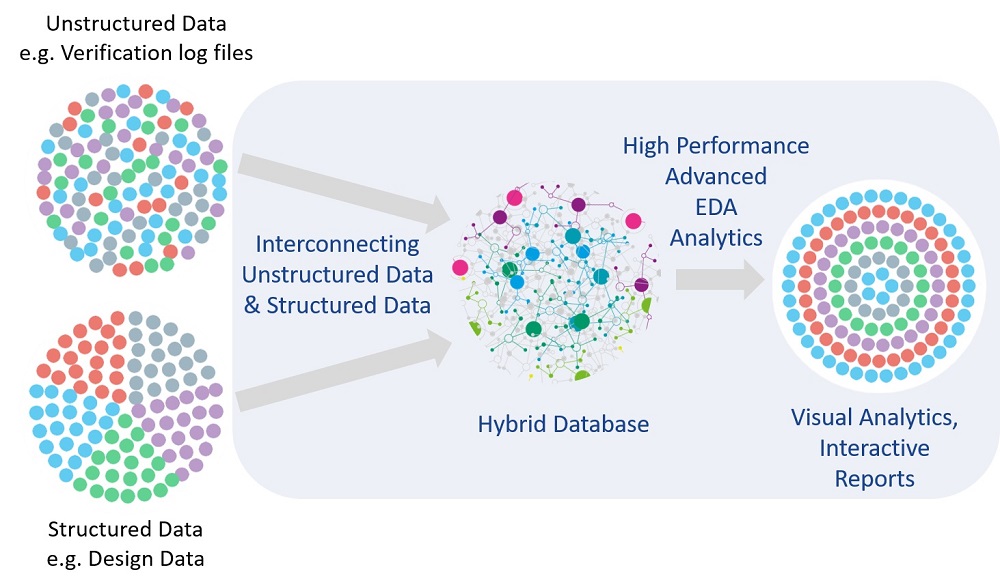
IC Manage Envision VA has the unique ability to interconnect your unstructured verification data with structured design data in a hybrid database. If there is a flag or concern in the verification results, such as stalling in the reduction of bugs or a degradation in the pass/fail results for a specific test, Envision-VA has identifiers to link those problems areas to related design activity or changes.
This technology makes Envision VA useful to both verification and design teams, as it enables them to more quickly determine and resolve the source of a slowdown or even reversal in verification progress.
For example, if a verification engineer ran a regression with a thousand tests and five failed, IC Manage Envision-VA will link which tests passed or failed together with related design changes. Engineers can get the design file delta between similar runs to be able to “drill down” and investigate where the issues are likely centered based on design change churn.
Team members can look at detailed file change lists to see the blocks that changed, and identify, for example, which 10 of the 50 had problems. They can even look at the file level.
6. Hybrid Database Interconnects Unstructured & Structured Data
IC Manage’s underlying big data technology takes unstructured verification log data and the structured design data and interconnects them in a hybrid database. IC Manage also utilizes high performance advanced analytics modules tuned for functional verification.
Additionally, IC Manage’s RESTful API allows you to customize dashboards for individual team members and management.
About the Author
Shiv Sikand,
Executive Vice President
IC Manage, Inc.
Shiv Sikand is founder and Vice President of Engineering at IC Manage, and has been instrumental in achieving its technology leadership in design and IP management for the past 15 years. Shiv has collaborated with semiconductor leaders such as Cypress, Broadcom, Maxim, NVIDIA, AMD, Altera, and Xilinx in deploying IC Manage’s infrastructure to enable enterprise-wide design methodologies for current and next generation process nodes.
Shiv has deep expertise in design and IP management, with a long history of developing innovative solutions in this field. He started in the mid 1990’s during the MIPS processor era at SGI, authoring the MIPS Circuit Checker before specializing on design management tools for a number of advanced startups, including Velio Communications and Matrix Semiconductor, before founding IC Manage in 2003. Shiv received his BSc and MSc degrees in Physics and Electrical Engineering from the University of Manchester. He did his postgraduate research in Computer Science also at Manchester University.

